
In 2026, the term “smart city” gets thrown around a lot. But a city that installs a few thousand sensors and calls itself smart is missing the point. True smart city sustainability is not about the number of connected devices. It is about measurable outcomes: cleaner air, lower energy bills, fairer access to services, and a lighter ecological footprint. For urban planners, sustainability consultants, and local government officials, the challenge is separating real progress from marketing spin. That is where smart city sustainability benchmarks come in. These are the metrics that tell you whether an initiative is actually working. Let’s look at the seven benchmarks that cut through the noise and reveal genuine sustainability performance in 2026.
Measuring smart city sustainability in 2026 requires moving past vanity metrics. Focus on seven core benchmarks: carbon intensity per capita, renewable energy share, equitable access to green spaces, real-time air quality data, circular waste rates, affordable mobility options, and digital inclusion. These indicators reveal whether a city is genuinely sustainable or just wearing a high-tech disguise.
Why Standard Metrics Fall Short
Many cities still rely on outdated indicators. They count the number of smart streetlights or the total miles of bike lanes. Those numbers look good in a press release. But they do not tell you if the streetlights use renewable power or if the bike lanes connect low-income neighborhoods to job centers. A city could score high on a traditional “smart city index” while its poorest residents breathe the worst air and spend a third of their income on transportation.
The solution is a new generation of benchmarks that combine environmental, social, and governance factors. These are the smart city sustainability benchmarks 2026 that actually measure what matters.
Benchmark 1: Carbon Intensity Per Capita
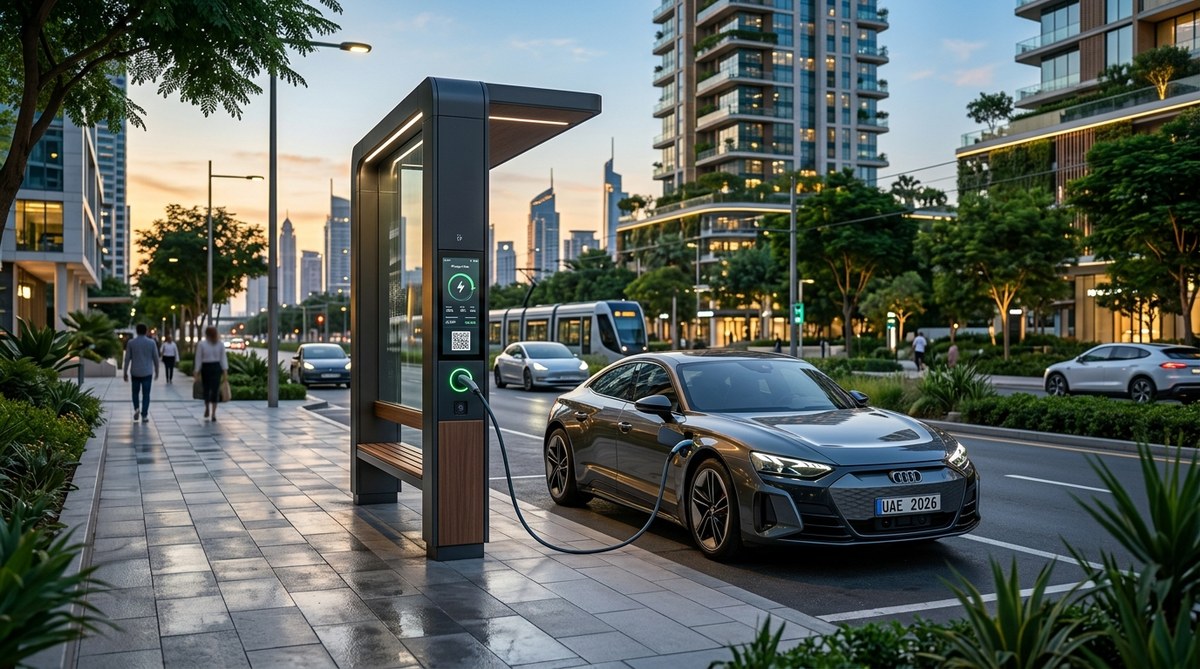
This is the gold standard. Carbon intensity per capita measures the total greenhouse gas emissions produced by a city’s activities, divided by its population. It accounts for energy use, transportation, waste, and industrial processes. A city can lower its carbon intensity by switching to renewable energy, improving building efficiency, and promoting transit. For example, a city that powers its public buildings with solar panels and runs its bus fleet on electricity will see this number drop year over year.
Benchmark 2: Renewable Energy Share
A city’s grid might be 40 percent renewable today. That is a good starting point. The benchmark tracks the percentage of total energy consumed that comes from renewable sources. This includes solar, wind, geothermal, and hydro. It covers municipal operations, residential buildings, and commercial districts. The goal is 100 percent, but the path matters more. Cities that show steady annual increases are on the right track. Those that plateau may need to invest in local microgrids or community solar programs. The integrating renewable energy solutions to create sustainable urban ecosystems article offers a deeper look at how cities can accelerate this transition.
Benchmark 3: Equitable Access to Green Space
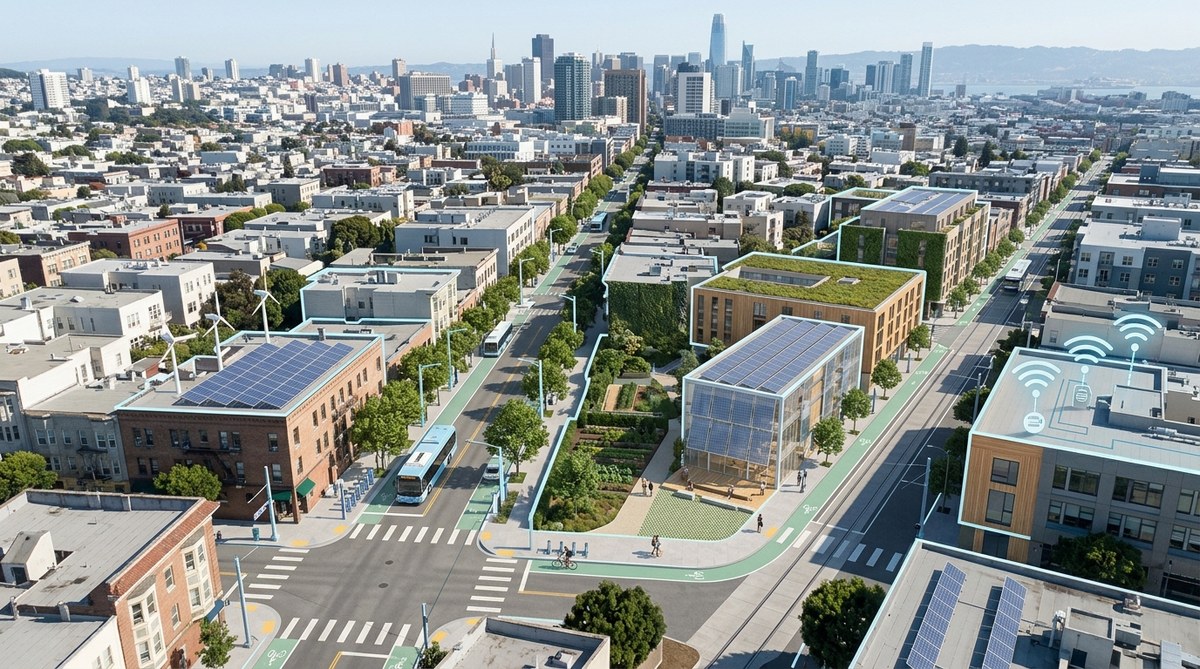
Sustainability is not just about the environment. It is about people. This benchmark measures how far residents live from a park, a community garden, or a green corridor. The target is a 10 minute walk for everyone. Cities should map green space access by income level and neighborhood. If wealthy districts have three times more tree canopy than low-income areas, that is a red flag. Urban planners can use this data to prioritize new parks and green roofs in underserved areas. The piece on implementing green roofs and urban gardens to boost city sustainability provides practical steps for closing that gap.
Benchmark 4: Real-Time Air Quality Index
Gone are the days of checking air quality once a year. In 2026, residents expect real-time data. This benchmark tracks the average AQI across a city’s sensor network. It also measures the number of “good air days” per year. A smart city should publish this data on a public dashboard. When AQI spikes, the city should trigger alerts and adjust traffic or industrial activity. Cities that integrate air quality data with their transportation systems can reduce congestion and improve public health at the same time. Learn more about this in the guide on how can smart city technology improve air quality in urban centers.
Benchmark 5: Circular Waste Rate
Landfills are a major source of methane. A circular waste rate measures the percentage of municipal waste that is recycled, composted, or reused. It also tracks how much waste is diverted from incineration. Smart bins with fill-level sensors help optimize collection routes. But the benchmark goes further. It asks: does the city have policies that encourage product repair and material recovery? A city with a high circular waste rate is one where discarded electronics are refurbished, food scraps become soil, and construction debris is crushed into new building materials. The article on how smart city technologies are revolutionizing urban waste management in 2026 shows how cities are achieving this.
Benchmark 6: Affordable Mobility Options
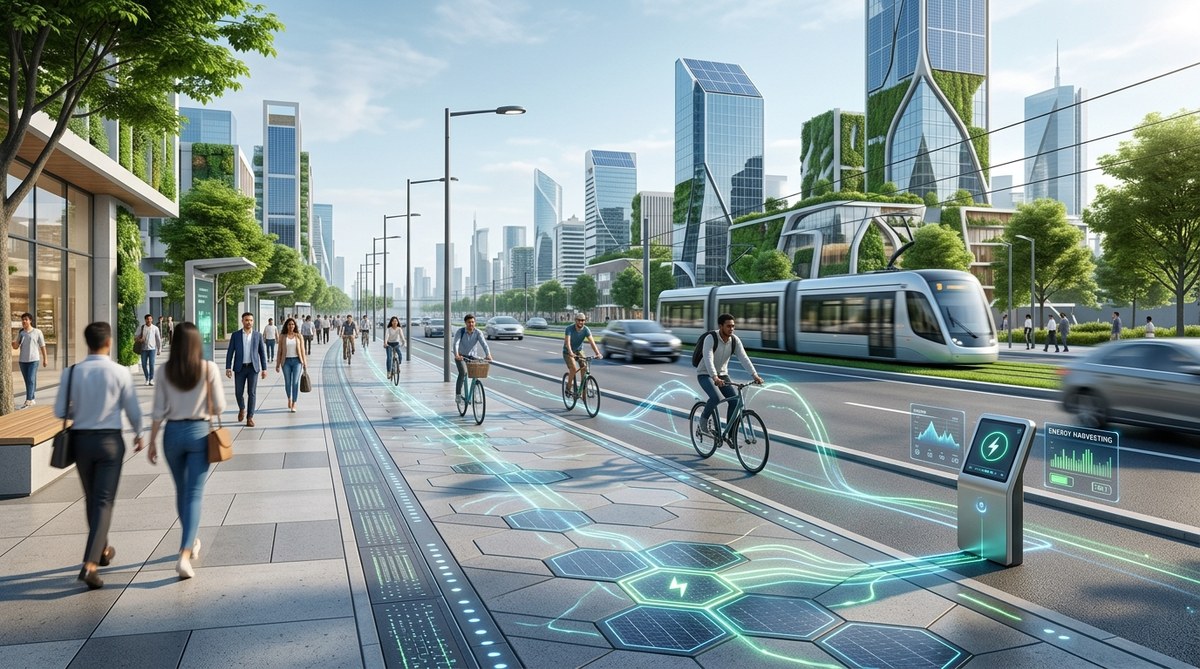
Transportation is the largest source of emissions in many U.S. cities. This benchmark measures the percentage of residents who can reach essential services (jobs, schools, grocery stores) within 30 minutes using a combination of walking, biking, public transit, or shared mobility. It also tracks the cost of these options as a share of household income. If a family spends more than 15 percent of its income on getting around, the system is not sustainable. Cities that invest in bus rapid transit, protected bike lanes, and fare subsidies improve this metric. The 5 smart city initiatives that are transforming public transportation in 2026 article highlights real-world examples.
Benchmark 7: Digital Inclusion Rate
A smart city that leaves a third of its residents offline is not smart at all. This benchmark measures the percentage of households with reliable, affordable broadband access. It also tracks digital literacy programs and public Wi-Fi availability. In 2026, accessing city services, applying for jobs, and participating in civic life all require internet connectivity. Cities that close the digital divide see higher civic engagement and better economic outcomes. The 7 key strategies for deploying equitable broadband access in smart city districts offers a roadmap for getting there.
How to Apply These Benchmarks
Adopting these benchmarks is not a one-time task. It is an ongoing process. Here is a simple workflow for urban planners and consultants:
- Audit your current data. Gather all existing reports on energy, waste, transportation, and air quality. Identify gaps.
- Select a baseline year. Use 2025 or 2026 as your reference point. This makes future comparisons meaningful.
- Install the necessary sensors. Deploy IoT devices for air quality, waste bin fullness, and energy use. Make sure the data is open and accessible.
- Set target thresholds. For each benchmark, define a three year and a ten year goal. For example, reduce carbon intensity by 30 percent by 2029.
- Publish a public dashboard. Transparency builds trust. Let residents see progress in real time.
- Review and adjust annually. Sustainability is not static. Update your targets as technology and policy evolve.
Common Pitfalls to Avoid
Even well-intentioned cities can stumble. Here is a table that contrasts common mistakes with the right approach.
| Mistake | Better Approach |
|---|---|
| Counting total emissions without adjusting for population | Use carbon intensity per capita |
| Celebrating a high recycling rate without checking contamination | Measure the circular waste rate, which accounts for quality of recycling |
| Installing smart lights but ignoring their power source | Track the renewable energy share that powers city infrastructure |
| Focusing only on downtown green spaces | Map equitable access across all neighborhoods |
| Reporting air quality from a single monitor | Use a dense network of sensors for real-time data |
| Promoting a new transit line without measuring ridership demographics | Track affordable mobility options by income level |
| Providing free Wi-Fi in one district | Measure the digital inclusion rate citywide |
Expert Advice on Getting Started
“Start with the data you already have. Many cities sit on a goldmine of information from utility bills, transit logs, and building permits. The problem is that this data lives in separate departments. The first step is not buying new sensors. It is breaking down the silos between your water, energy, and transportation teams. Once you connect those data streams, the benchmarks will start to reveal themselves.”
- Dr. Amara Singh, urban sustainability researcher at the University of Texas
This advice rings true for 2026. The technology exists. The challenge is organizational. Cities that invest in cross-department data platforms see faster progress on every benchmark.
What the Benchmarks Look Like in Practice
A few U.S. cities are already using versions of these metrics. Austin, Texas, publishes a real-time sustainability dashboard that tracks carbon intensity, renewable energy share, and equitable access to parks. Minneapolis measures its circular waste rate and has set a goal of zero waste by 2030. Seattle monitors digital inclusion through its community broadband network. These cities prove that the benchmarks are not theoretical. They are actionable.
For a broader view of how these indicators fit into the larger picture, the 7 smart city benchmarks that measure true sustainability in 2026 pillar page provides a complete framework.
Building a Culture of Measurement
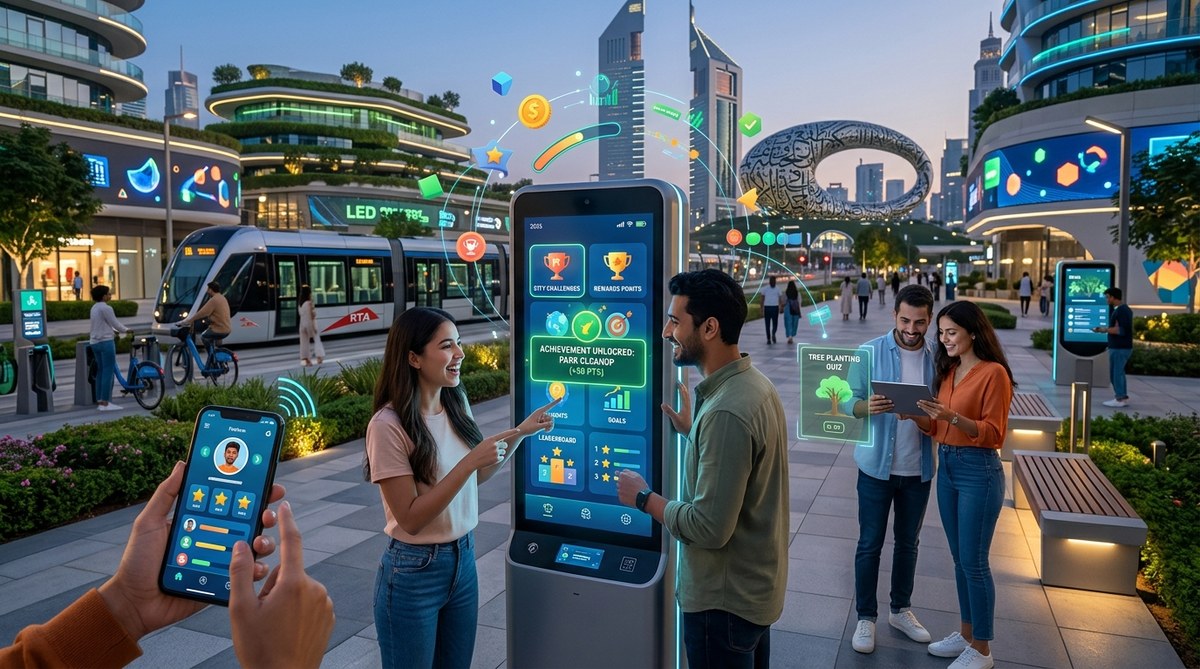
Benchmarks only work if people use them. That means training city staff, educating elected officials, and engaging the public. A dashboard is useless if nobody looks at it. Cities should host quarterly town halls where they present benchmark data and answer questions. Some cities use gamification to encourage residents to reduce energy use or increase recycling. The how smart cities are using gamification to boost resident engagement in 2026 article offers creative ideas for making data fun.
The Role of Technology in Data Collection
Technology makes these benchmarks possible. IoT sensors, edge computing, and AI analytics turn raw data into actionable insights. But the technology is a means, not an end. A city that deploys thousands of sensors without a clear measurement framework will drown in data. Start with the benchmarks, then choose the tools that support them. The how to leverage IoT sensors for real-time urban infrastructure monitoring guide walks through the practical steps.
A Final Look at the Seven Benchmarks
Here is a summary list for quick reference:
- Carbon intensity per capita
- Renewable energy share
- Equitable access to green space
- Real-time air quality index
- Circular waste rate
- Affordable mobility options
- Digital inclusion rate
These seven indicators form the backbone of any credible smart city sustainability assessment in 2026. They balance environmental performance with social equity. They reward cities that make meaningful progress, not those that just look good on paper.
Putting These Benchmarks to Work
The best time to start measuring was five years ago. The second best time is today. Pick one benchmark from the list. Maybe it is the one where you already have decent data. Set a baseline. Publish it. Then set a target for next year. When you hit that target, move on to the next benchmark. Over time, these small wins add up to a city that is genuinely smarter and more sustainable. Your residents will notice. Your budget will thank you. And your city will be ready for whatever comes next.



Leave a Reply