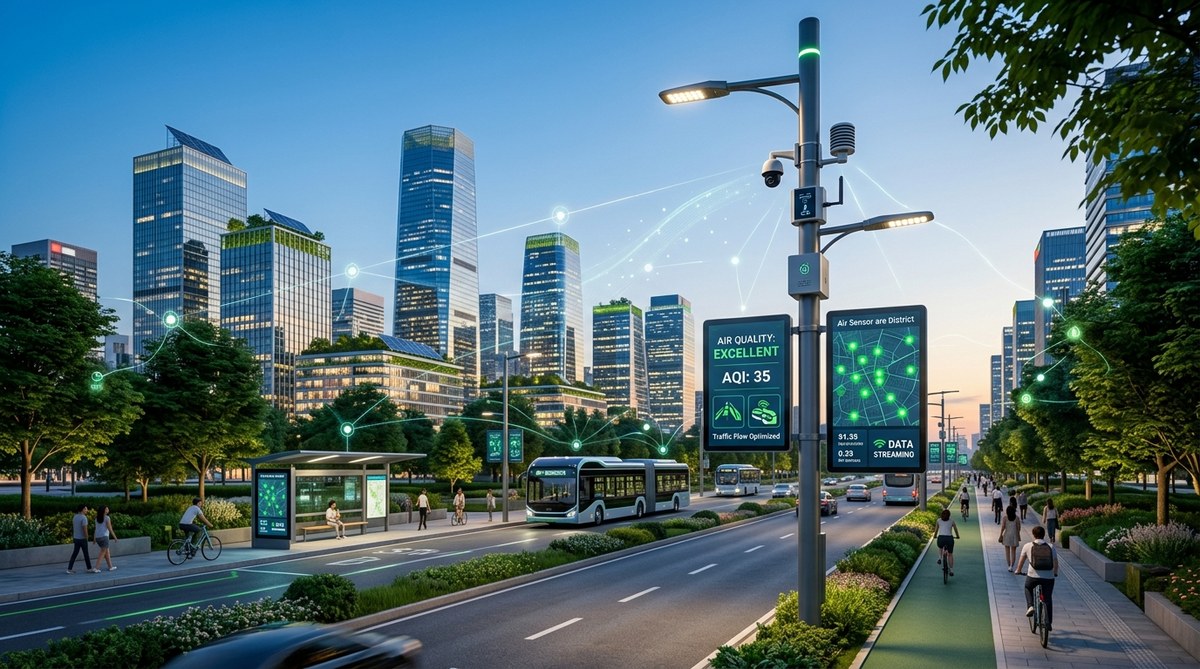
You step outside on a summer morning in a dense urban core. The sky looks hazy. Your phone buzzes with a notification: “Air quality index in your neighborhood is moderate. Consider an alternative route to work.” That message is not random. It comes from a network of sensors, traffic signals, and data platforms working together. This is the reality of smart city air quality improvement in 2026, and it is changing how cities tackle pollution.
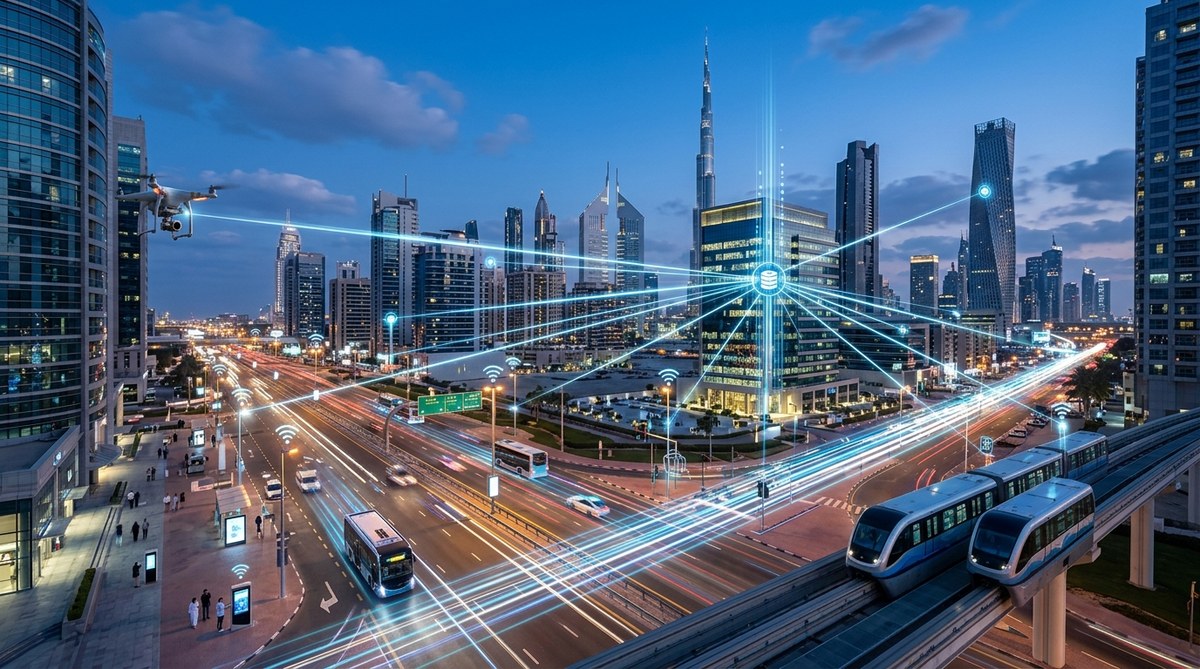
Smart city technology improves air quality through three connected layers: hyperlocal sensing that maps pollution block by block, data analytics that turn raw numbers into traffic or building decisions, and green infrastructure managed by smart controls. Cities like Los Angeles, London, and Singapore already use these tools to cut emissions and warn citizens in real time. The same approach works for any urban center ready to invest in sensor networks and intelligent policy. Cleaner air starts with better information.
The Sensing Network That Sees What We Cannot
Air pollution is invisible in many ways. You smell it, you feel it in your throat, but you rarely see the full picture. That is where smart city sensors change the game.
Small, low cost IoT sensors are now mounted on streetlights, bus stops, and building facades. They measure particulate matter (PM2.5 and PM10), nitrogen dioxide, ozone, carbon monoxide, and sulfur dioxide. Some even track volatile organic compounds and real time wind patterns to predict how pollution moves through street canyons.
These sensors are not spread randomly. Urban planners study traffic flow, population density, and building geometry to place them where data matters most. A sensor near a school tells a different story than one near a highway interchange.
The key pollutants tracked by modern sensor networks include:
- PM2.5 and PM10 from vehicle exhaust, construction dust, and industrial activity
- Nitrogen dioxide (NO2) from diesel engines and power plants
- Ground level ozone (O3) formed when sunlight reacts with other pollutants
- Carbon monoxide (CO) from incomplete fuel combustion
- Sulfur dioxide (SO2) from industrial processes and heating systems
- Volatile organic compounds (VOCs) from paints, solvents, and fuel evaporation
Each sensor feeds data into a central platform every few minutes. That constant stream of information lets city officials see pollution spikes as they happen. A truck idling near a loading dock, a construction site kicking up dust, a traffic jam blocking a major artery. All of it shows up on a dashboard in near real time.
For environmental policymakers, this level of detail is a first. Before smart sensors, cities relied on a handful of government monitoring stations. Those stations are accurate, but they are spaced miles apart. They miss the hyperlocal variations that matter most to human health. A child walking to school might breathe air that is 30 percent more polluted than what the nearest official station reports. Smart sensors close that gap.
From Raw Data to Real Action
Data alone does not clean the air. The magic happens when cities act on what the sensors show.
Here is the practical process that many smart cities follow to turn readings into results:
- Collect and calibrate. Sensors gather raw readings every 60 to 300 seconds. The system cross references those readings against reference grade monitors to correct for drift or weather interference.
- Analyze and visualize. Machine learning models identify patterns. They separate normal traffic pollution from unusual events like a nearby fire or a construction surge. Dashboards show color coded maps that anyone from a city council member to a concerned resident can read.
- Trigger automated responses. When pollution exceeds a certain threshold, the system can take action without waiting for a human. It might change traffic signal timing to reduce idling, send alerts to citizens through a city app, or notify school administrators to keep children indoors for recess.
That third step is where the real change happens. Automated responses cut response time from hours or days to seconds.
Consider a real scenario from 2025 in a mid sized European city. Sensors near a primary school detected a sudden NO2 spike. The system traced the source to a delivery truck that was idling while the driver made rounds. It sent an automated alert to the driver through a connected vehicle system and notified the fleet manager. The truck moved within two minutes. The spike flattened.
Cities that invest in this kind of closed loop system see measurable improvements. A study of smart traffic interventions in Barcelona showed a 15 percent reduction in NO2 levels near sensor equipped intersections over a two year period. That is the difference between a code yellow air day and a code green one.
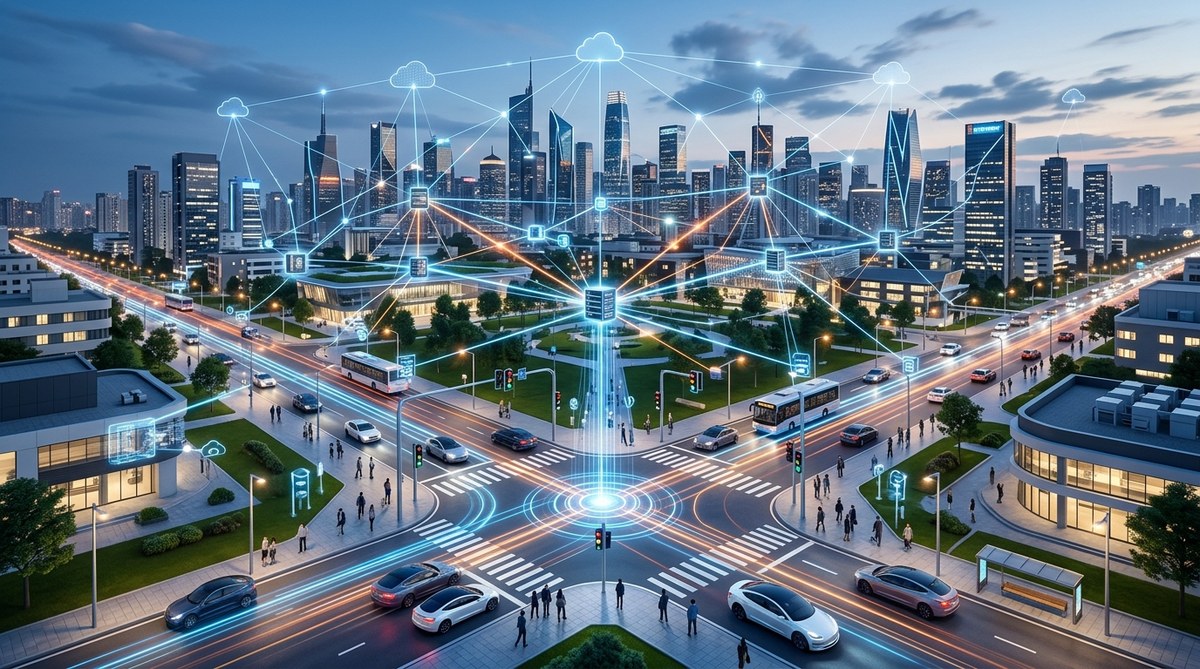
A Closer Look at Smart Traffic Management
Traffic is the single largest source of air pollution in most urban centers. It is also the easiest to influence with smart technology.
Adaptive traffic signals use real time data to keep vehicles moving. Instead of running on fixed timers, they adjust based on actual traffic volume. Fewer stops mean less idling. Less idling means lower emissions. The math is simple.
Cities also use dynamic congestion pricing. When pollution sensors near a downtown core show elevated readings, tolls for entering that zone increase automatically. Drivers get a notification on their navigation app. Some choose to delay their trip or take public transit. The result is a measurable drop in traffic during peak pollution hours.
“Smart traffic systems are the lowest hanging fruit for urban air quality. You do not need to build new roads or buy new buses. You just need to connect your traffic lights to your air quality sensors and let the software make better decisions.”
Dr. Maria Chen, Urban Air Quality Researcher, MIT Senseable City Lab
The same principle applies to freight and logistics. Smart loading docks use sensors to detect when a delivery bay is free. Trucks no longer circle the block waiting for a spot. They receive a direct notification and head straight to the dock. That cuts emissions from circling trucks by as much as 40 percent in some pilot programs.
Comparing the Tools That Make It Happen
Not all smart city air quality tools are created equal. Different technologies serve different purposes. The table below breaks down the main approaches and what each one does best.
| Technology | Primary Function | Best For | Limitation |
|---|---|---|---|
| Fixed IoT sensor nodes | Continuous monitoring at stationary points | Mapping pollution along known corridors and near sensitive sites | Limited coverage without a dense network |
| Mobile sensors on buses or taxis | Capturing pollution across a wider area | Creating dynamic heat maps of the whole city | Less precision at any single point |
| Satellite based remote sensing | Regional overview from orbit | Detecting large scale trends and transboundary pollution | Low resolution for street level decisions |
| Machine learning prediction models | Forecasting pollution hours or days ahead | Giving citizens time to adjust behavior and planners time to act | Accuracy depends on quality of input data |
| Smart traffic signals | Reducing vehicle idling at intersections | Cutting NO2 and CO in dense downtown areas | Requires integration with existing traffic infrastructure |
Each city needs a mix of these tools. A sprawling metro area like Los Angeles uses satellite data for regional patterns while layering thousands of ground sensors near freeways and ports. A denser city like Boston relies more on fixed sensors and mobile units on public buses.
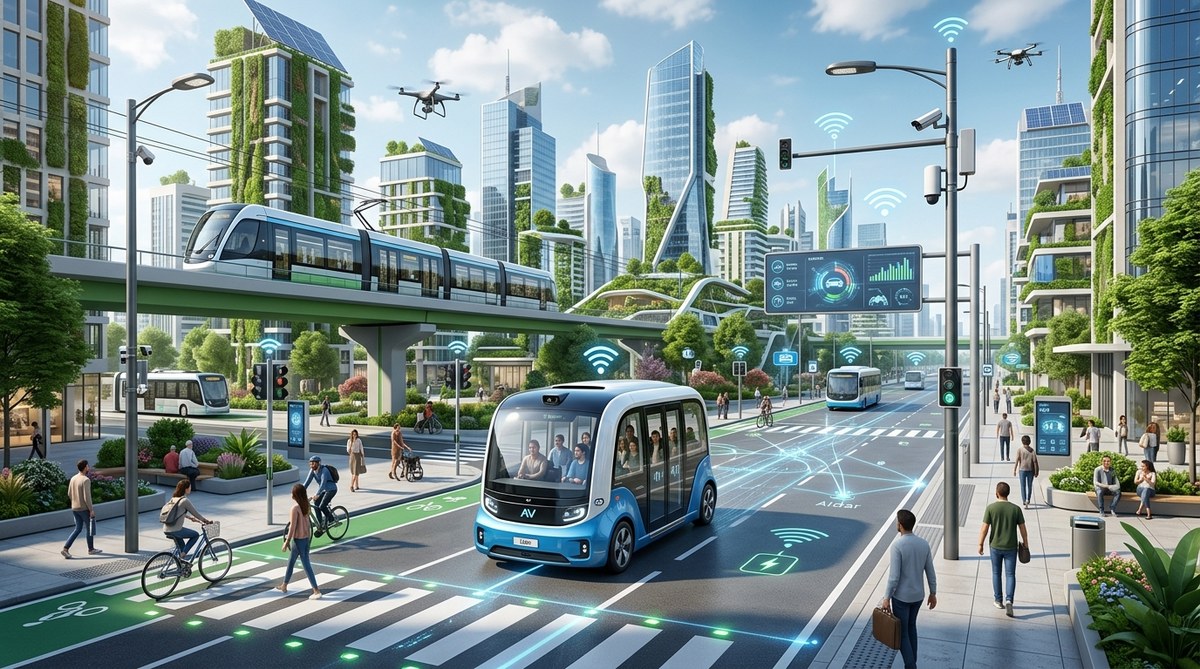
Bringing Green Infrastructure Online
Sensors and traffic signals are only part of the story. Smart city technology also makes green infrastructure more effective at cleaning the air.
Green roofs, living walls, and urban gardens absorb pollutants directly. Plants trap particulate matter on their leaves and take up gases through their stomata. But these systems need water, nutrients, and monitoring to survive. Smart irrigation controls water usage based on soil moisture and weather forecasts. Sensors track leaf health and alert maintenance crews when a plant is stressed.
When a green roof is managed well, it can reduce local PM2.5 concentrations by 10 to 20 percent during the growing season. That is a meaningful improvement for the people living and working in the surrounding buildings.
The combination of smart sensors and green infrastructure is especially powerful in street canyons. Those are the deep corridors between tall buildings where pollution gets trapped. A smart city can place vertical green walls on the sides of buildings and monitor their air cleaning performance in real time. If a wall is not performing as expected, the system adjusts irrigation or alerts the maintenance team.
For planners who want to see more on this topic, the approach aligns with implementing green roofs and urban gardens to boost city sustainability. The same sensor networks that monitor pollution can also track soil moisture, temperature, and plant health.
The 2026 Outlook for Urban Air Quality
Right now, the smart city air quality improvement field is moving fast. A few trends stand out for 2026 and beyond.
First, sensor costs continue to drop. A capable PM2.5 sensor that cost 500 dollars three years ago now costs around 150 dollars. That makes dense deployments feasible for mid sized cities with modest budgets.
Second, AI models are getting better at predicting pollution before it happens. Some cities now use forecast systems that give a 48 hour warning. Schools can plan outdoor activities around expected air quality. Hospitals can prepare for an increase in respiratory cases.
Third, citizen engagement is growing. Many cities now offer public APIs for their air quality data. Developers build apps that show the cleanest walking route from point A to point B. Commuters can choose low pollution paths for their morning jog or their bike commute.
Fourth, the link between air quality and equity is getting more attention. Low income neighborhoods often have worse air quality and fewer monitoring stations. Smart city programs are starting to prioritize sensor placement in underserved areas. Data from those sensors then drives policy changes like enhanced tree planting or restrictions on heavy truck routes.
For urban planners and policymakers, the message is clear. The technology exists. The costs are falling. The public wants cleaner air. What remains is the will to connect the pieces.
Bringing Cleaner Air Within Reach
Smart city air quality improvement is not a distant promise. It is happening now on streets in Los Angeles, London, Singapore, and hundreds of other cities. The formula is straightforward. Sense the air in real time. Analyze the data with smart algorithms. Act through traffic signals, citizen alerts, and green infrastructure. Measure the results and repeat.
If you are an urban planner, start with one intersection near a school. Put a sensor on a light pole. Connect it to the traffic signal controller. Watch what happens over three months. You will see the data change. You will see the air change. And you will know exactly what to do next.
The same tools that let a city manage its energy grid, its water supply, and its public transit can also manage its air. That is the core idea behind harnessing data analytics to transform urban living in smart cities. When you treat air quality as a data problem rather than an impossible one, the solutions start to appear.
Go outside tomorrow morning. Check the air quality on your phone. If it is good, thank the sensors you cannot see. If it is bad, ask your city leaders why they are not using the tools that already work. Cleaner air is a choice. Smart technology makes that choice easier.
Leave a Reply