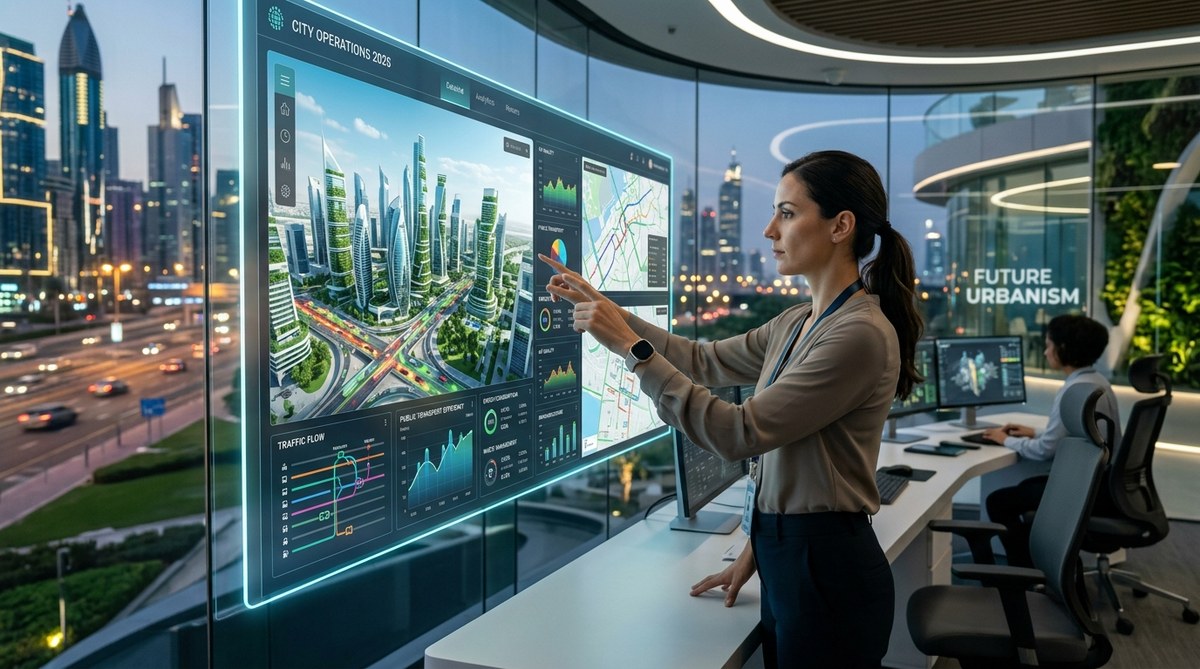
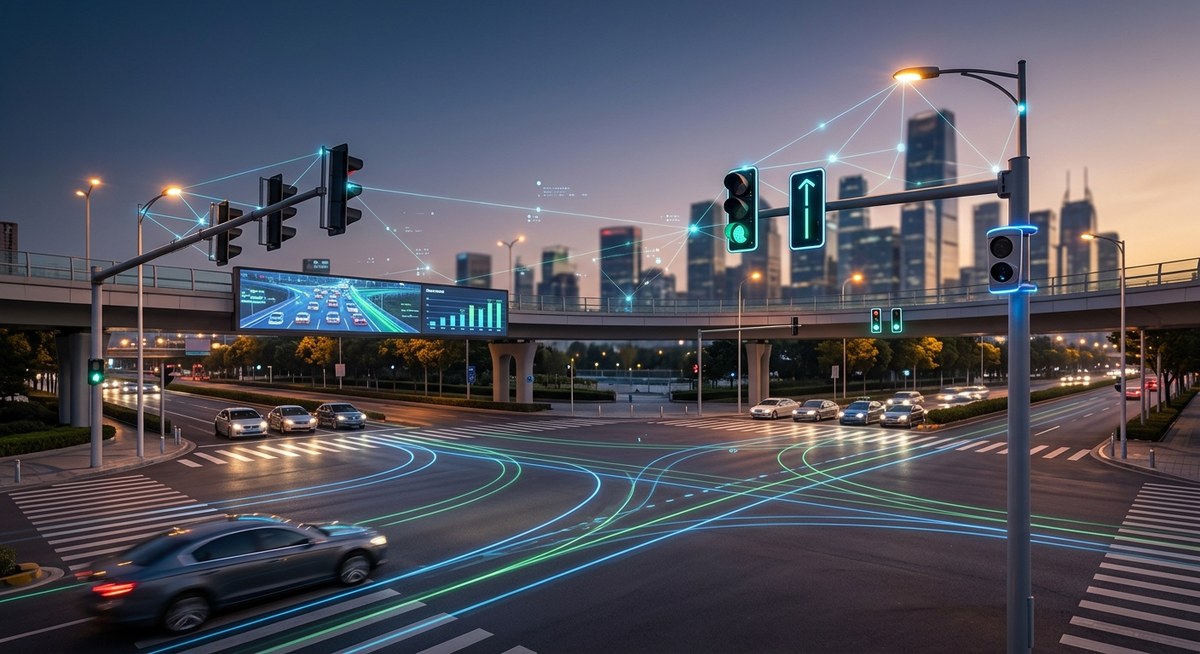
The conversation around city planning has changed. It’s no longer about static maps and yearly reports. In 2026, urban planners sit in front of live dashboards that pulse with the heartbeat of the city. Traffic flows update every second. Air quality readings shift with the wind. Energy use spikes before you can blink. These smart city dashboards are not just pretty screens. They are the central nervous system of modern urban planning.
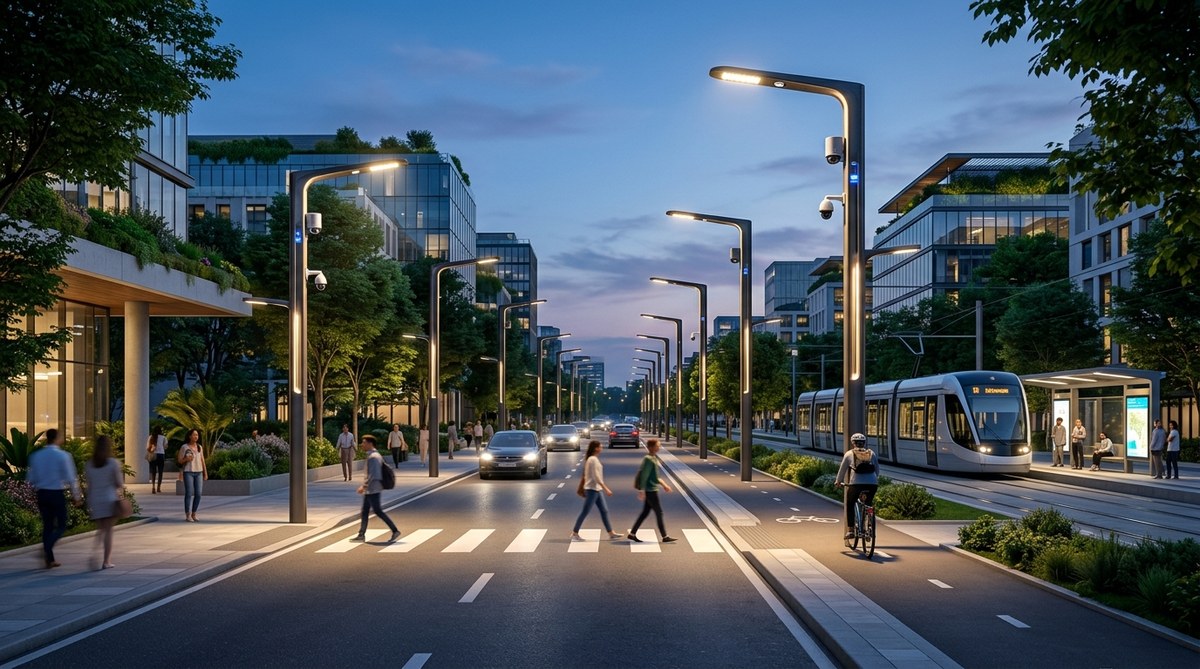
Smart city dashboards in 2026 give urban planners a single view of real-time operations. By blending IoT sensor data, satellite imagery, and citizen feedback, these tools turn raw numbers into actionable insights. Planners can now predict traffic jams, adjust energy grids, and respond to emergencies faster than ever. The result is more responsive, sustainable, and livable cities.
What Makes Smart City Dashboards Indispensable in 2026
Think of the last time you sat in traffic or waited for a bus. That frustration is exactly what dashboards aim to prevent. By pulling data from thousands of sensors, dashboards show planners exactly what is happening right now. They also help forecast what is coming. This shift from reactive to proactive planning is a huge leap.
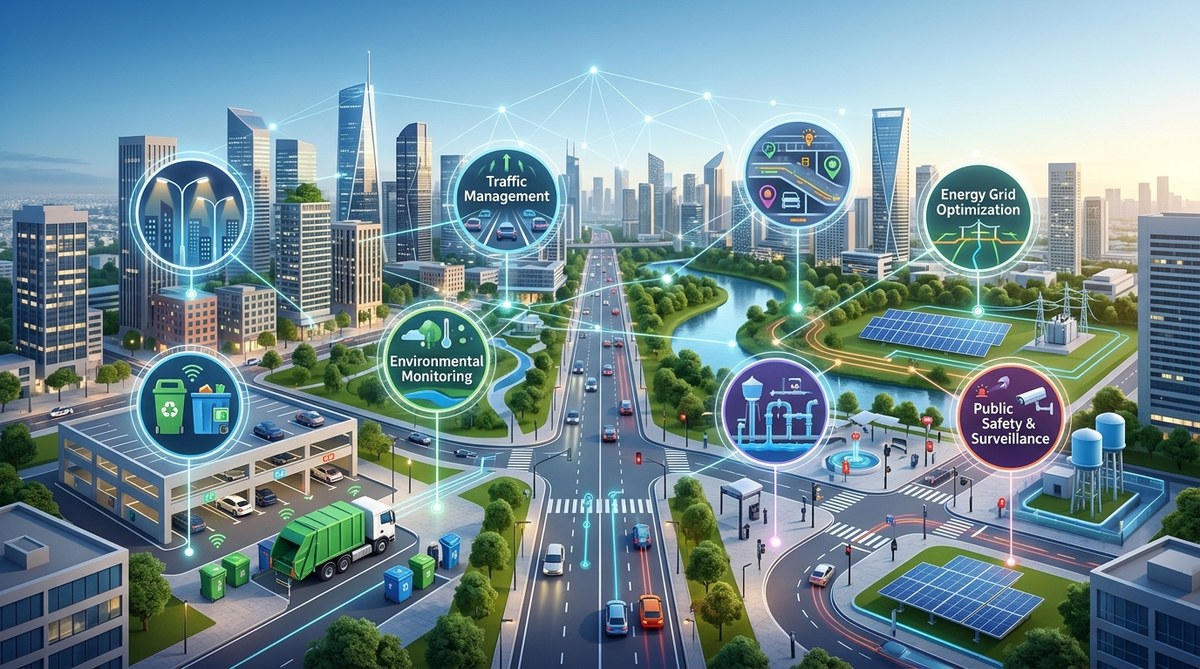
Cities like Los Angeles and New York have already adopted dashboard systems that monitor everything from streetlight energy usage to water pressure in fire hydrants. But the real power comes from integration. When you can see a traffic jam forming and simultaneously check nearby air quality and emergency response times, you can make better decisions on the spot.
A good dashboard also breaks down silos. The transportation department might run their own systems, and the environmental office might have separate ones. A unified city dashboard pulls that data together. Suddenly, a planner can see that rerouting trucks could lower emissions in a school zone. That kind of insight was buried in spreadsheets before.
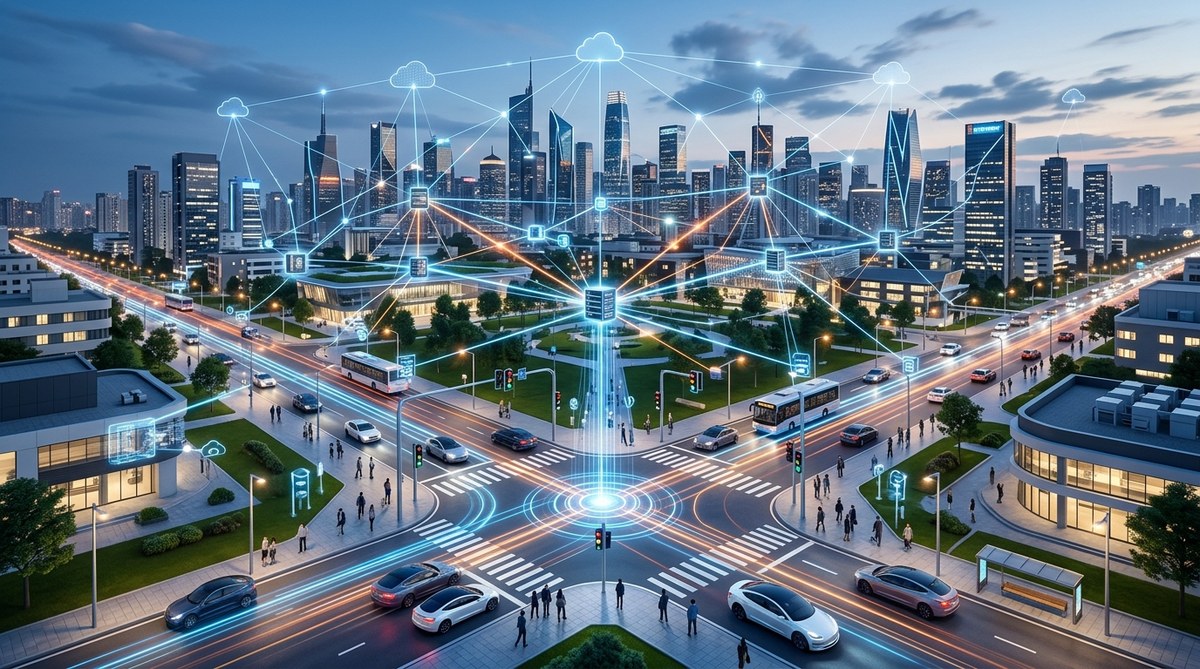
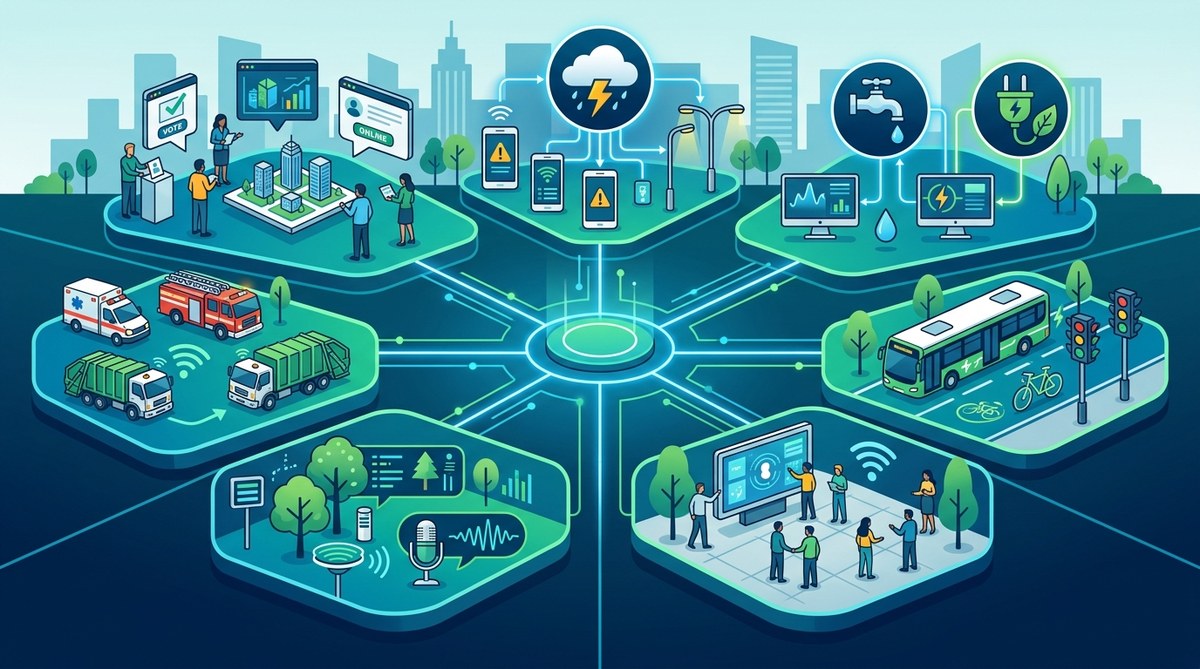
The Data Sources Feeding Modern Dashboards
Smart city dashboards rely on several layers of data. Each layer adds depth and accuracy.
- IoT sensors along roads, in buildings, and on streetlights collect everything from traffic counts to noise levels.
- Satellite and drone imagery gives planners a bird’s eye view of land use, green space, and construction progress.
- Citizen feedback apps let residents report potholes, broken lights, or flooding. These human reports fill gaps the sensors miss.
- Weather and climate models integrate with dashboards to predict how rain or heat waves might affect traffic and energy demand.
When all these streams flow into one interface, patterns emerge. For example, a dashboard might show that a certain intersection has more accidents on rainy days. That insight leads to better signage or road design.
If you are working on integrating these systems, you might find value in reading about harnessing data analytics for smarter urban infrastructure design. It covers how cities connect disparate data sources for better decisions.
How to Implement a Dashboard System That Works
Rolling out a city dashboard is not just about buying software. It requires careful planning and community input. Here are the practical steps:
- Identify the core problems. Start with the biggest pain points. Is traffic congestion the top issue? Or is it energy waste in public buildings? Let the challenges drive your dashboard design, not the other way around.
- Choose open standards for data. Avoid vendor lock in. Use open APIs and standard data formats so that future systems can plug in easily. This saves money and headaches down the road.
- Pilot with a single department. Pick one area, like public transportation, and build a focused dashboard. Test it with real staff. Learn from their feedback before scaling citywide.
- Train the people, not just the tech. A beautiful dashboard is useless if no one trusts it. Offer hands on training and create a culture where data drives decisions. Encourage staff to ask “What does the dashboard show?” before making calls.
- Set up a feedback loop. Dashboards need to evolve. Create a process for users to suggest new data sources or visualizations. The best dashboards grow smarter over time.
Common Mistakes and How to Avoid Them
Even the best dashboards can fail if planners fall into certain traps. The table below shows some frequent errors and how to sidestep them.
| Mistake | Safer Approach |
|---|---|
| Overloading the screen with every data point available | Focus on key performance indicators. Less is more. Show trends, not raw numbers. |
| Ignoring data quality and sensor calibration | Set up automatic alerts for bad data. Regularly verify sensor readings. |
| Building dashboards without input from end users | Involve traffic engineers, city managers, and citizens in the design process. |
| Treating the dashboard as a one time project | Budget for ongoing updates and new data integrations. A dashboard is a living tool. |
| Forgetting about data privacy and security | Anonymize citizen data and follow strict cybersecurity protocols. Only share aggregated views. |
Cybersecurity is especially critical. If a dashboard gets hacked, the consequences can be severe. For a deeper look at protecting your city’s data, read why smart city cybersecurity should be a top priority for urban planners in 2026.
Expert Insight: The Human Element Still Matters
I spoke with Maria Torres, a smart city consultant who has helped deploy dashboards in a dozen mid sized U.S. cities. She shared a key lesson.
“The dashboard will always reflect the biases and blind spots of the data you feed it. If your sensors are only in wealthy neighborhoods, you will miss problems in underserved areas. The best urban planners I work with use dashboards as a starting point, not the final answer. They still walk the streets and talk to residents. The dashboard amplifies their intuition, it doesn’t replace it.”
That advice rings true. A dashboard is a tool, not a boss. The planner’s judgment remains essential.
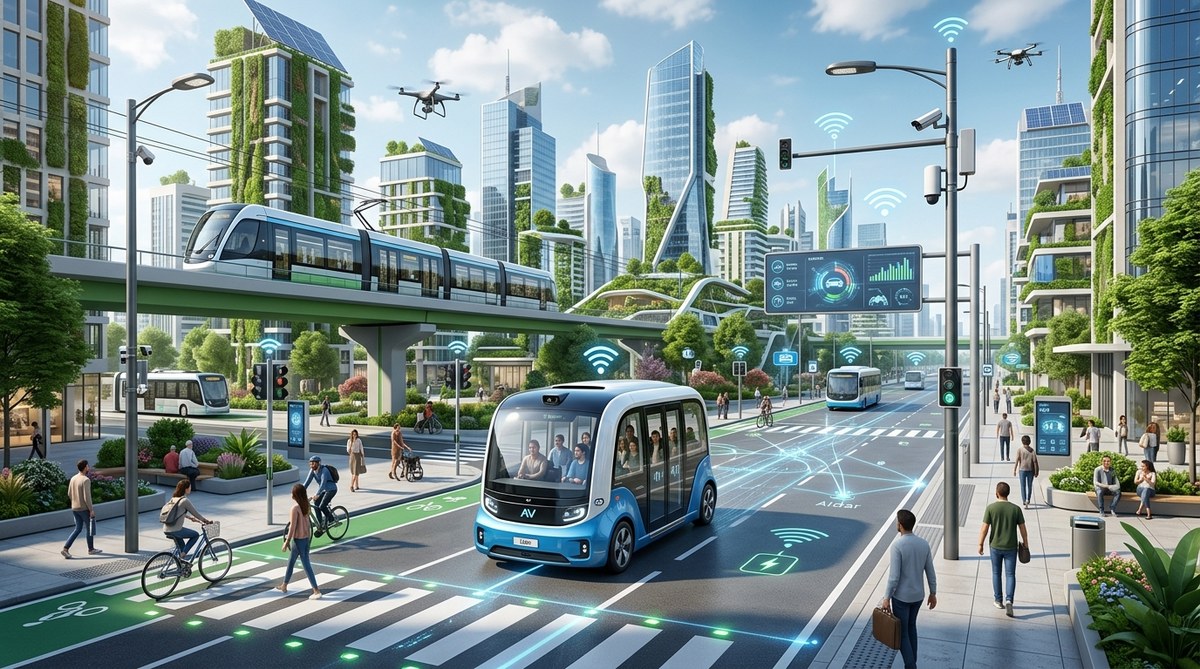
Where Smart City Dashboards Are Headed Next
Looking further into 2026 and beyond, dashboards will get even smarter. Artificial intelligence will start suggesting actions, not just showing data. Imagine a dashboard that says: “Traffic on Main Street is projected to reach a standstill in 20 minutes. We recommend adjusting signal timing by 5 percent to ease flow.” That kind of agentic AI is already being tested in cities like Singapore and Helsinki.
Digital twins will become more common too. A digital twin is a virtual copy of a city that runs simulations. Planners can test a new bike lane or a park redesign in the digital twin before spending a dime in the real world. The dashboard becomes the window into that twin. For a fuller picture, see are digital twins the key to smarter infrastructure maintenance in 2026.
Citizen engagement is also changing. Some dashboards now include a public face. Residents can see live data on air quality or bus arrivals. This transparency builds trust and helps people make better daily choices. A well designed public dashboard can turn passive residents into active partners in city operations.
Making the Most of Dashboards in Your City
If you are a planner or a municipal IT manager, you might be wondering how to start. Begin small. Pick one urgent problem and one data source. Build a prototype. Show it to a few colleagues. Get feedback quickly. That iterative approach will save you from building a fancy system that no one uses.
Also, remember that dashboards work best when they connect to other smart city initiatives. Pair your dashboard with a solid citizen engagement platform to include real people in the loop. And if you are working on sustainability, consider linking to green roof and urban garden programs so your dashboard can track their impact on heat island effects.
The most successful cities in 2026 are those that treat their dashboard as a daily companion. It is not a report that sits in a drawer. It is a living tool that reflects the city’s current state and helps planners steer toward a better future.
Your Next Step Toward Smarter Urban Planning
Dashboards are not magic. They are hard work. But the payoff is enormous. When a planner can see a problem forming and fix it before it becomes a crisis, that is the kind of efficiency that builds public trust and saves money.
Take a look at your current planning tools. Are they giving you the real time, integrated view you need? If not, 2026 is the year to push for change. Start conversations with your IT team. Look at grants for smart city technology. Attend webinars and talk to peers who have already made the leap.
Urban planning has always been about making cities better for the people who live in them. Smart city dashboards just give us a clearer picture of how to do that. The data is out there. The tools are ready. The only question left is: What will your city do with them?

Leave a Reply